Progress Check 1: Can You Weigh the Evidence?
Progress Check 1: Can You Weigh the Evidence?
Mission Objective
To demonstrate mastery of comparing two groups across the Data Cycle. Students should be able to identify uncontrolled factors in data collection, interpret stacked box plots, use measures of center and spread to compare distributions, and decide whether a difference between two groups is meaningful.
Investigative Task 1: Rules of the Throw
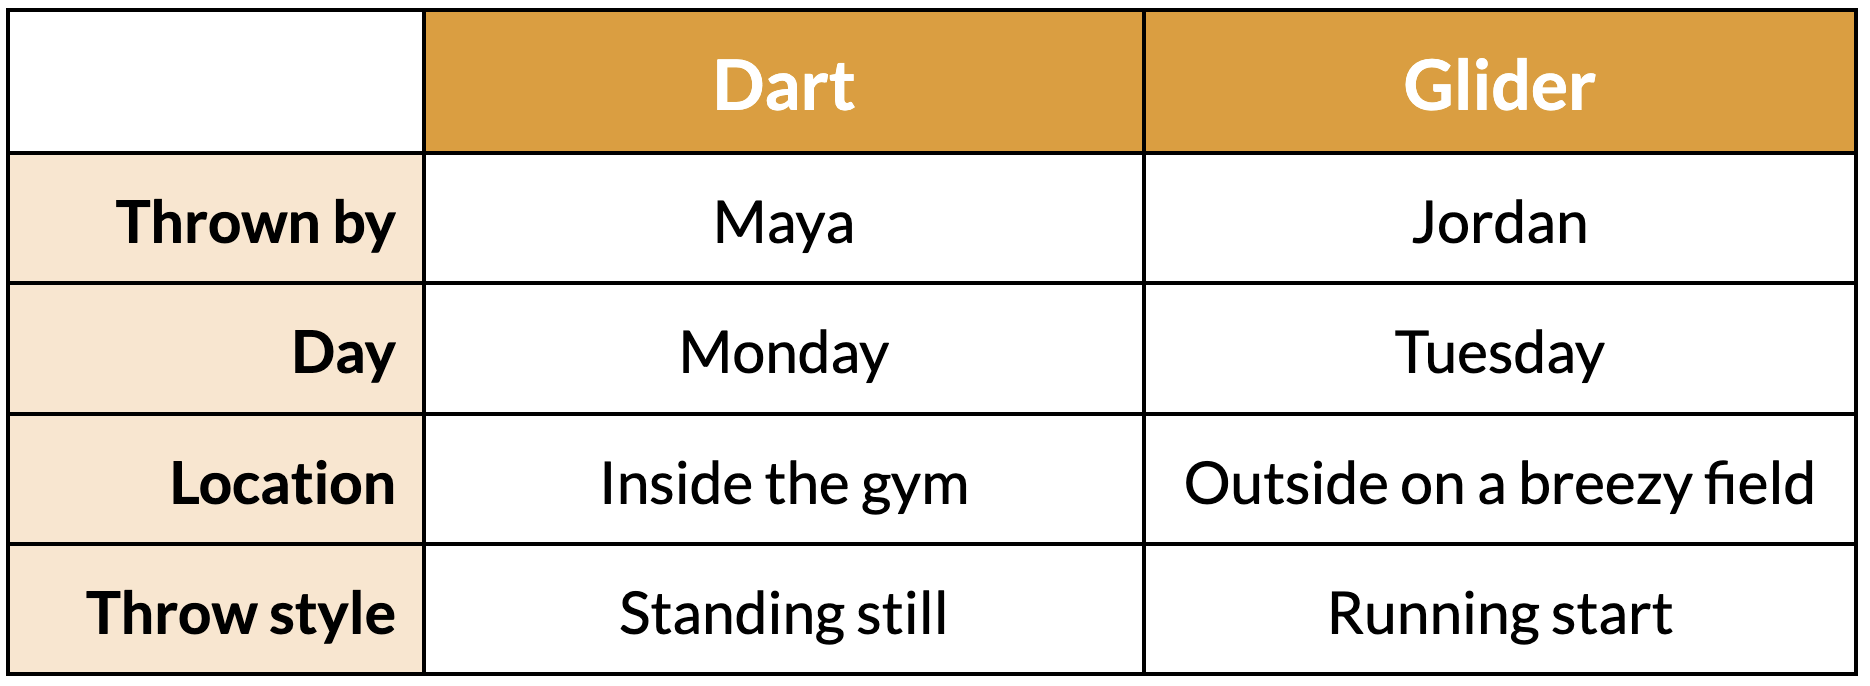
The school STEM club is testing two paper airplane designs, the Dart and the Glider, to decide which one to enter in the district Flight Challenge. Team members threw each airplane 20 times and measured how far it flew, in feet. Their testing notes are below.
-
List two factors, other than the airplane design, that were not kept the same during testing.
-
Data Detective Question: The Glider flew farther in this test. Can the club be sure the Glider’s design caused the longer flights? Explain.
-
Write two “Rules of the Throw” the club should follow the next time they test.
-
If the club follows every rule perfectly, will the Dart fly the exact same distance all 20 times? Yes No
Explain your reasoning.
Investigative Task 2: Reading the Evidence
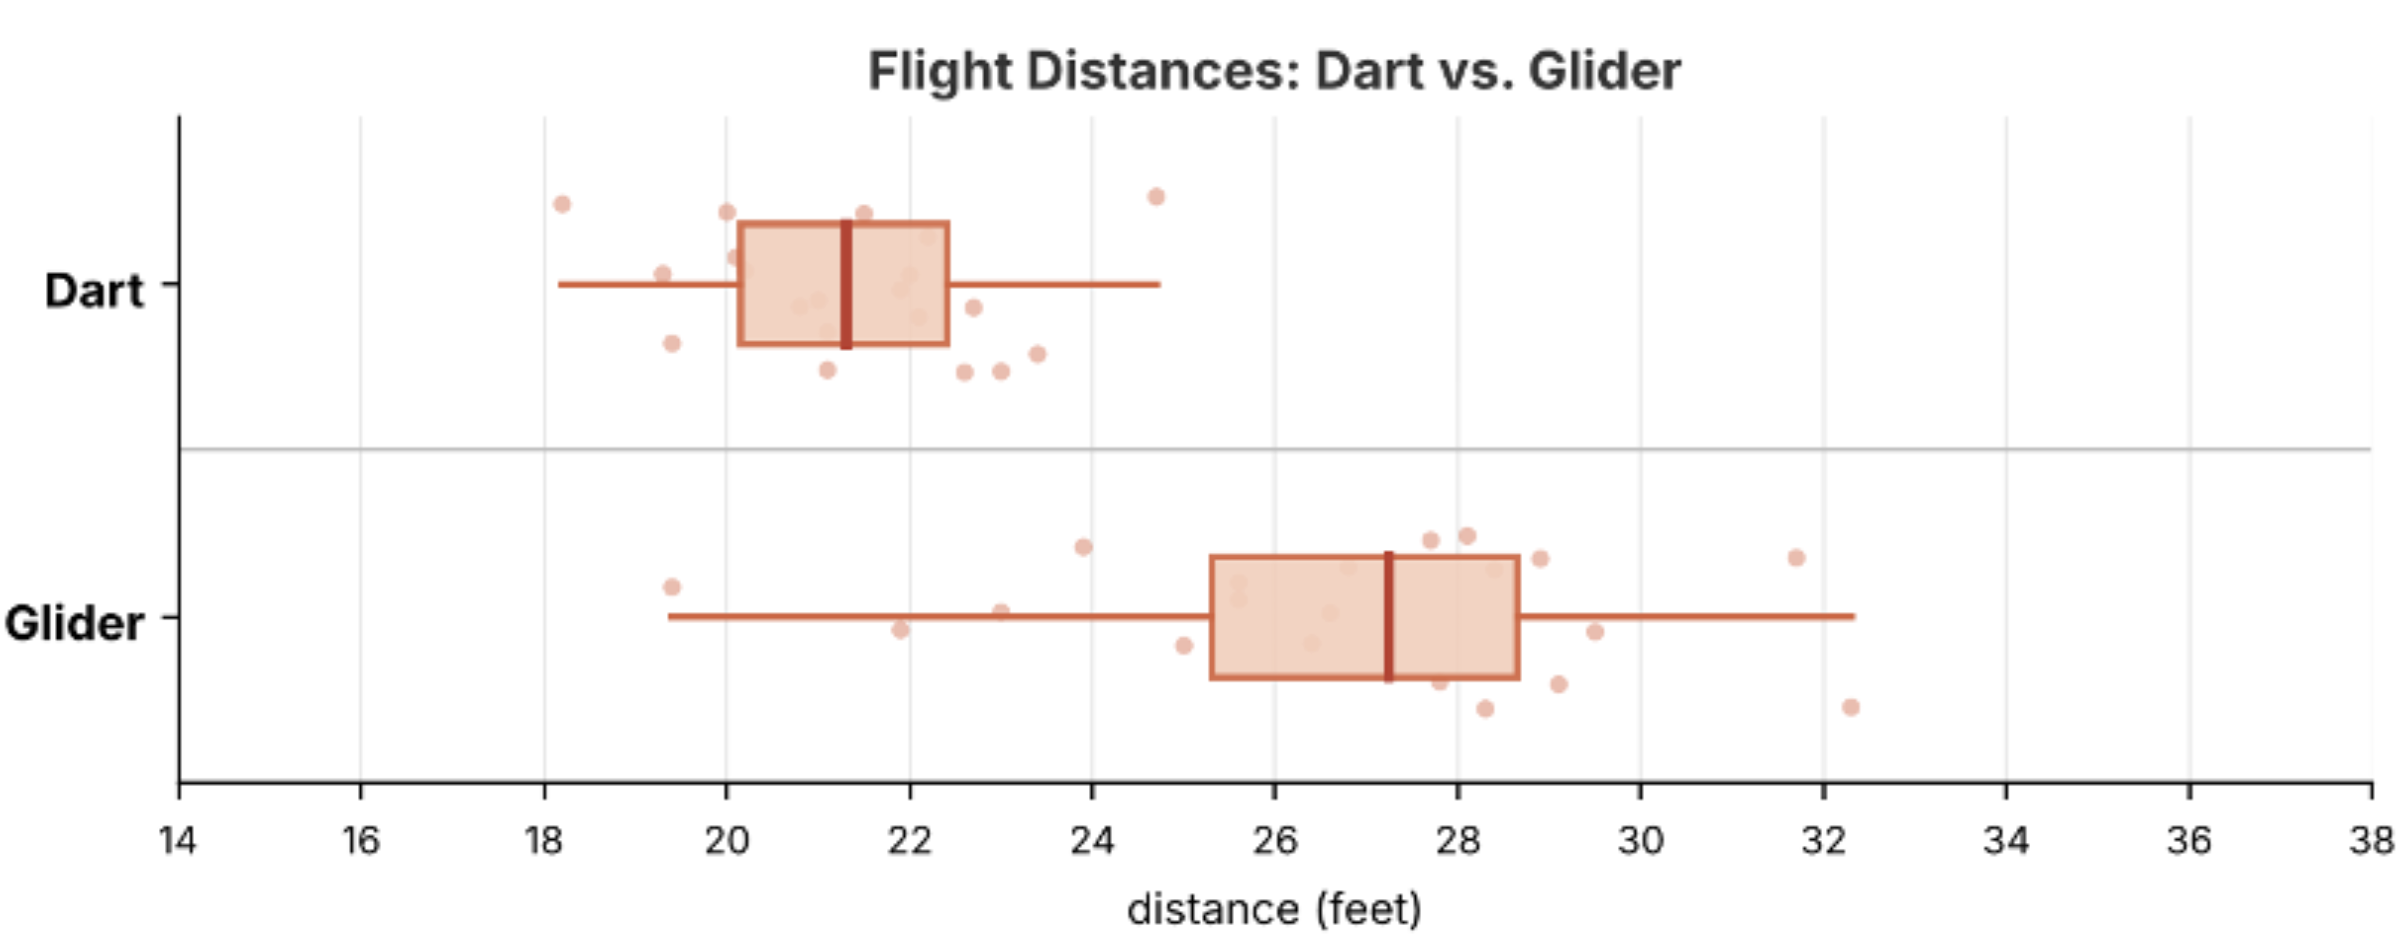
The club redid their testing using the same thrower, location, and starting line for every throw. The stacked box plots below show the 20 flight distances for each design.
-
Estimate the median flight distance for each design.
Dart Median:
Glider Median:
-
Which design typically flew farther? About how many more feet did it travel?
-
Which design is more consistent? Dart Glider
Explain your reasoning using a specific visual feature of the plot to justify your answer.
-
Describe the shape of the Glider’s distribution. What might explain it?
Investigative Task 3: Numerical Summaries
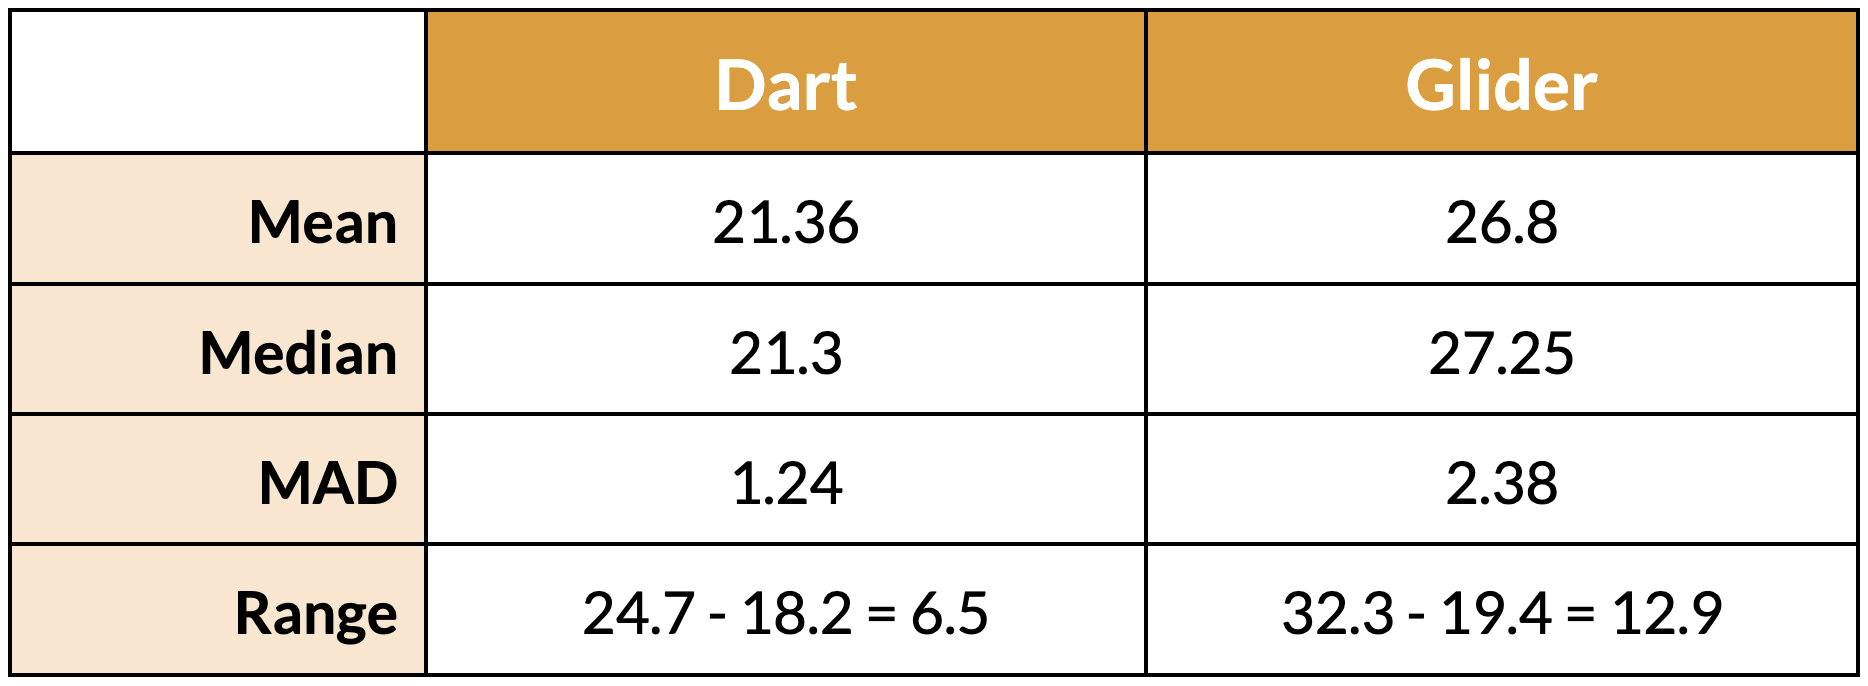
The club redid their testing using the same thrower, location, and starting line for every throw. The stacked box plots below show the 20 flight distances for each design.
-
Find the difference between the median flight distances of the two designs. Show your work.
-
Compare the MAD values. What do they tell you about each design?
-
The Flight Challenge has two events. Choose the best design for each event and justify your choice using one measure of center and one measure of spread.
Event 1 – Target Zone: The airplane must land between 20 and 23 feet.
Event 2 – Distance: The airplane that flies the farthest wins.
Investigative Task 4: Meaningful Difference?
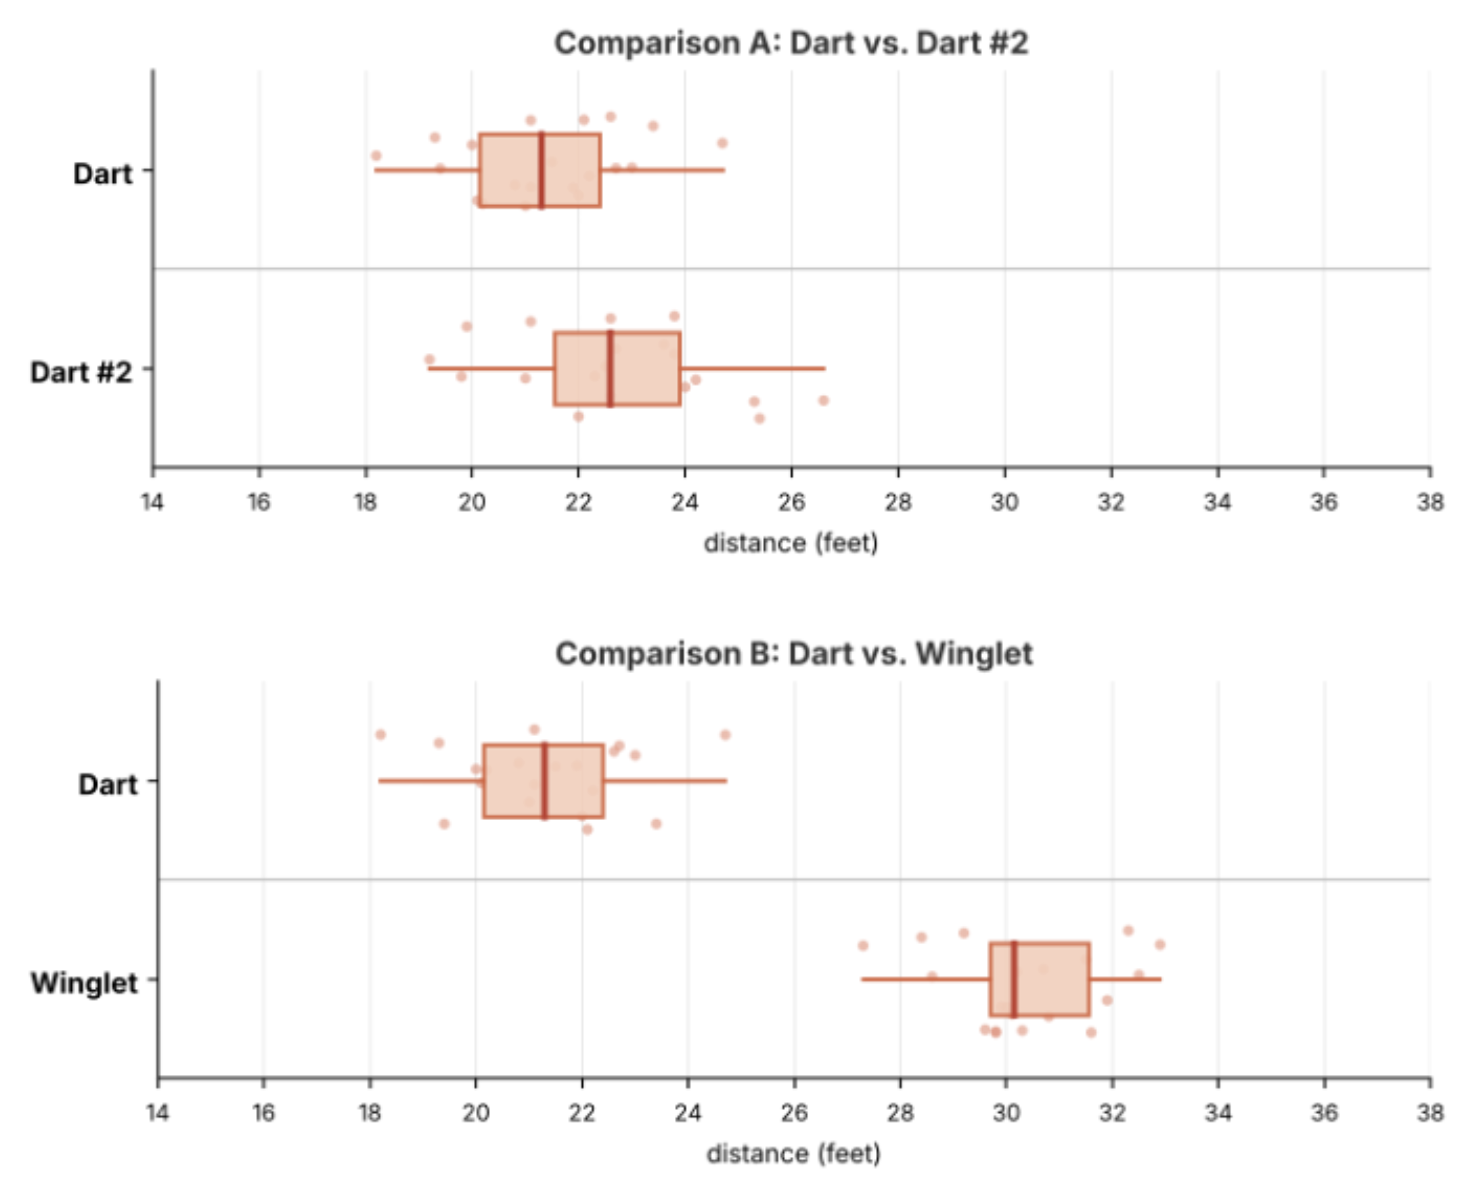
To check their testing, the club built a second Dart (Dart #2) using the exact same template and paper. They also built a new design called the Winglet, which has small folded-up wing tips. Each airplane was thrown 20 times using the same Rules of the Throw.
-
Describe how much the two box plots overlap in Comparison A and in Comparison B.
-
Which comparison shows a meaningful difference between the two airplanes? Explain your reasoning using both the overlap and the spread of the data.
-
Data Detective Question: Dart #2 had a slightly higher median than the original Dart. Does that mean Dart #2 is a better airplane? Explain.
Investigative Task 5: The Verdict
The STEM club captain has asked you, the Lead Engineer, for a final recommendation: which design should the club enter in the Distance Event? Use the evidence file below and the plots from Tasks 2 and 4.
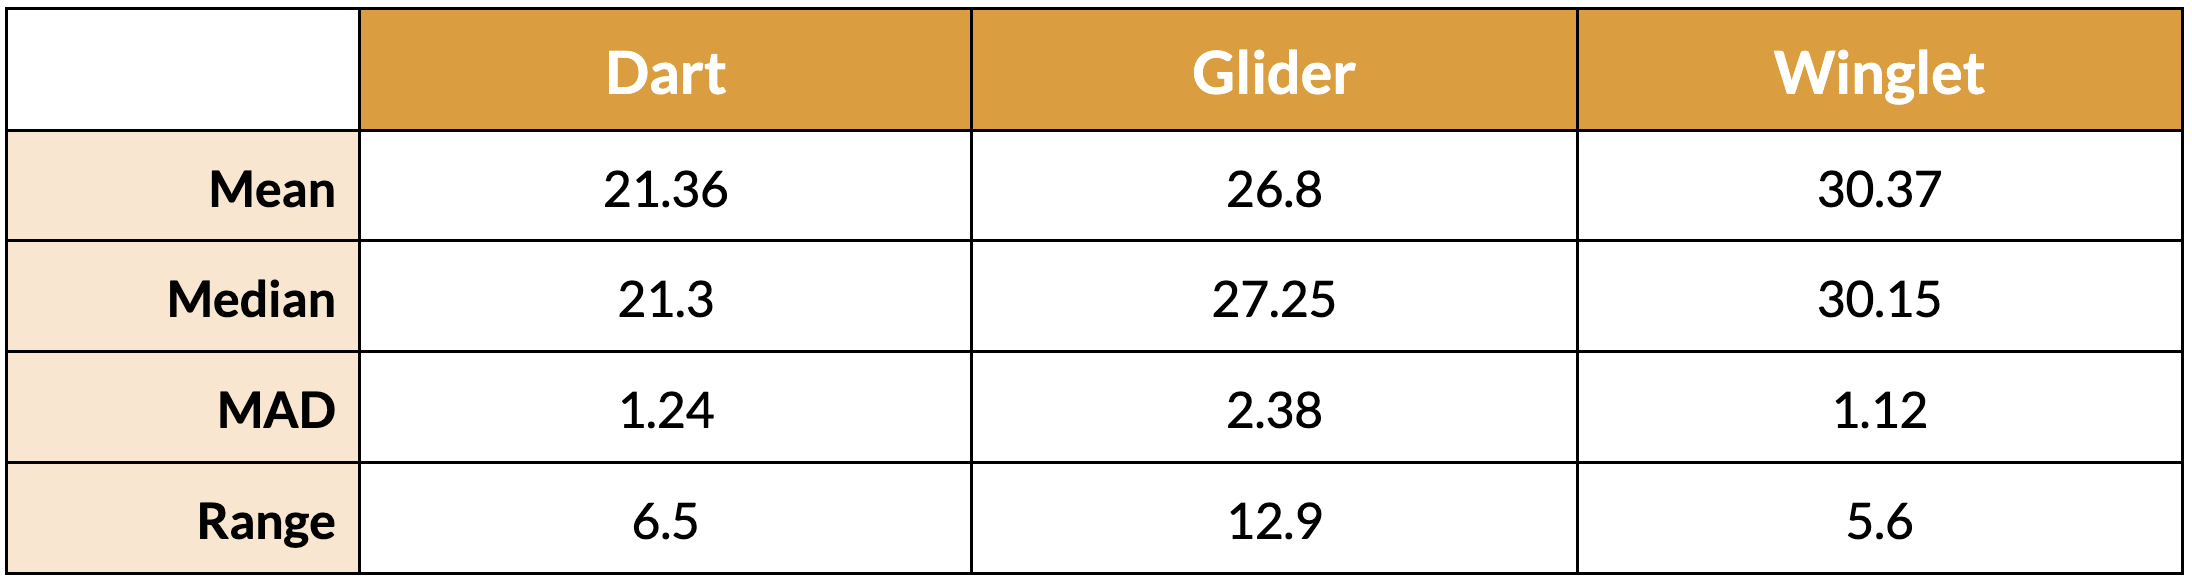
-
Write your recommendation to the captain. Your report must address the following:
Claim: Which design should the club enter?
Typical Performance: Use a measure of center to support your claim.
Reliability: Use a measure of spread to support your claim.
Final Recommendation: Should the club adopt this design, reject it, or do more testing? Justify your decision.