Progress Check 3: Can You Interpret Evidence?
Progress Check 3: Can You Interpret Evidence?
Mission Objective
To demonstrate mastery of the foundational concepts related to the Consider Data and Pose Questions phases of the Data Cycle. Students should be able to identify data types and organize information with a data table.
Investigative Task 1: Gamer Profiles Revisited
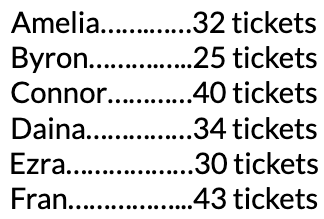
A local arcade is hosting a tournament and wants to summarize the ticket winnings for some of their most loyal players. Their data are provided below.
-
Calculate the Mean: Show your work using the “fair share” algorithm.
-
Sum of all observations:
-
Total number of observations:
-
Mean:
-
-
Analyze the spread. Find the Mean Absolute Deviation (MAD) for this group.
-
Step 1: The mean number of winning tickets is .
-
Step 2: List the absolute deviations (distances) of each point from the mean.
Amelia:
Byron:
Connor:
Daina:
Ezra:
Fran:
-
Step 3: Calculate the MAD:
-
Investigative Task 2: The Impact of Extreme Players
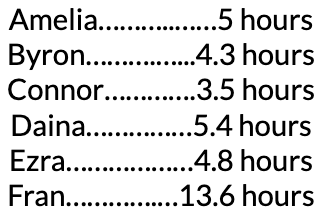
The arcade also recorded the number of hours each of the above players spent at the arcade during a one-week period. The data are provided below:
-
Which player seems to spend an unusual amount of time at the arcade?
-
Which player did you identify? Why?
-
What effect would this player’s value have on the group’s mean? Calculate and report the mean value to justify your reasoning.
Calculations:
Response & Reasoning:
-
What effect would this player’s value have on the group’s median? Calculate and report the median value to justify your reasoning.
Calculations:
Response & Reasoning:
-
Investigative Task 3: Creating & Interpreting Boxplots
The arcade wanted to analyze how fast players react when playing a popular “whack-a-mole” game. They did not grant you access to the full dataset, but were able to share the following five-number summary with you.
| Five-Number Summary of Reaction Times (in milliseconds) | ||||
|---|---|---|---|---|
| Minimum 120 |
Q1 180 |
Median 210 |
Q3 250 |
Maximum 400 |
-
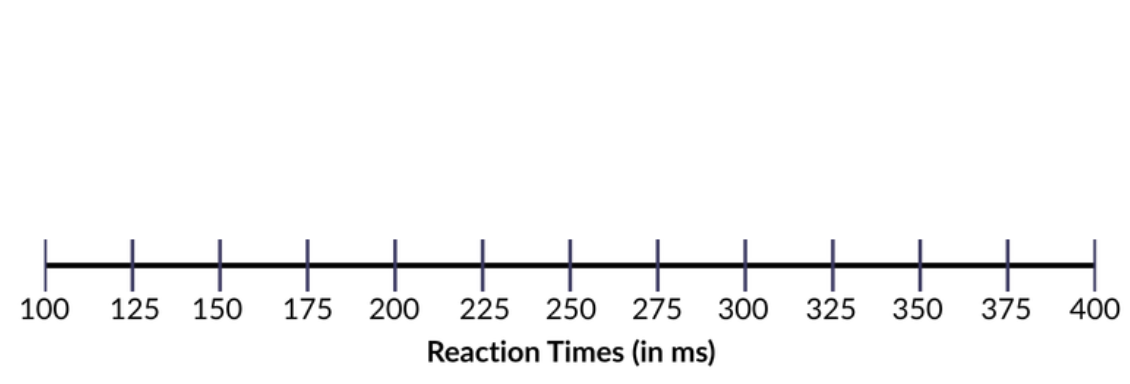
Sketch a boxplot of the data on the number line below. Label all values from the five-number summary.
-
Calculate the IQR. IQR =
-
One player had a reaction time of 245 milliseconds. In which section of the boxplot does this value fall? [Circle one.]
Lower whisker
(Minimum to Q1)Lower half of box
(Q1 to Median)Upper half of box
(Median to Q3)Upper whisker
(Q3 to Maximum) -
Data Detective Questions:
-
Is the median line closer to Q1 or Q3 in this boxplot?
-
What does this suggest about the shape of the distribution?
-
Investigative Task 4: Choosing the Right Tool
The owner of the arcade made the following claim: “I calculated the mean age of every player who came to the arcade last week to be 33.5 years old, so the typical arcade player is 33.5 years old.”
-
You notice that the owner’s mean calculation includes some older staff members who visit the arcade when they are off-duty. They tend to be a bit older than the typical customer.
-
What shape would you expect this distribution to have? Explain.
-
Based on your answer, would you expect the mean age to be greater than or less than the median age? Explain your reasoning.
-
Which measure of center and which measure of spread would you recommend the owner use to best represent the age of a typical player? Explain your reasoning.
Measure of Center:
I chose this because:
Measure of Spread:
I chose this because:
-