Progress Check 2: Can You Analyze Evidence?
Progress Check 2: Can You Analyze Evidence?
Mission Objective
To demonstrate mastery of the Analyze Data phase of the Data Cycle. Students should be able to distinguish between categorical and numerical plots, interpret bar graphs and histograms, and describe the shape of data distributions using statistical vocabulary.
Investigative Task 1: Gamer Profiles
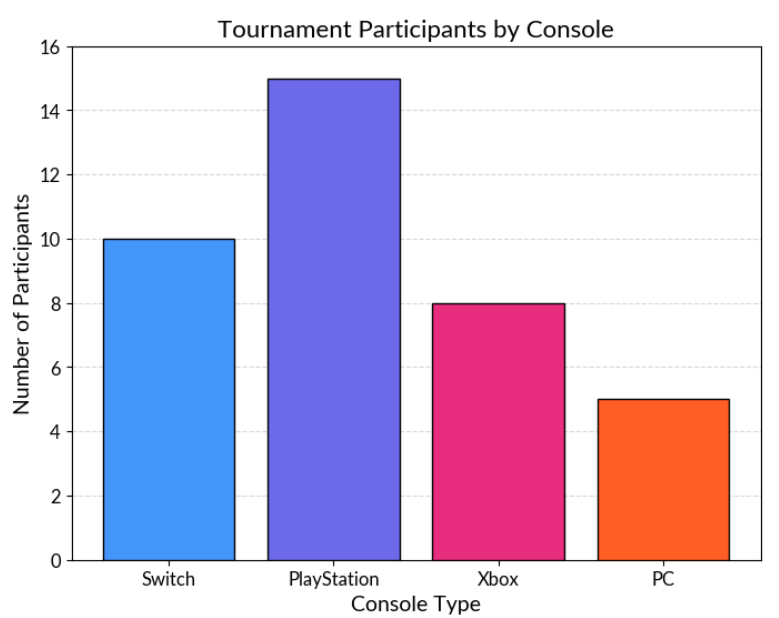
A local arcade is hosting a tournament and wants to know which gaming consoles are most popular among the participants. They collected data on “Console Type” and created the plot below.
-
Identify the name and type of variable depicted in the plot.
-
Variable name:
-
Variable type: [Circle one.] Categorical Numerical
-
-
Analyze the plot.
-
Name the plot type:
-
Which console type represents the mode of the data?
-
-
Data Detective Question: Why are there gaps, or spaces, between the bars in this plot?
Investigative Task 2: Game Score Distributions
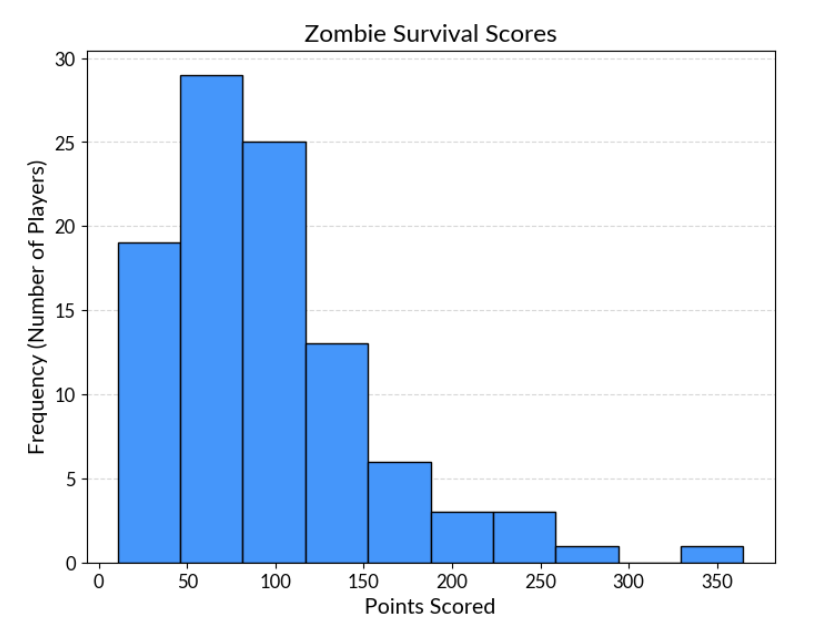
The arcade also tracked the point scores for 100 players in a difficult zombie survival game. Most players scored low, but a few experts scored very high.
-
Identify the name and type of variable depicted in the plot.
-
Variable name:
-
Variable type: [Circle one.] Categorical Numerical
-
-
Analyze the plot.
-
Name the plot type:
-
Describe the shape of the distribution.
-
-
Data Detective Question: If a player is in the “tail” of this distribution (the right side), does that mean they performed better or worse than most players? Explain your reasoning using the shape of the graph.
Investigative Task 3: Choosing the Right Tool for the Job
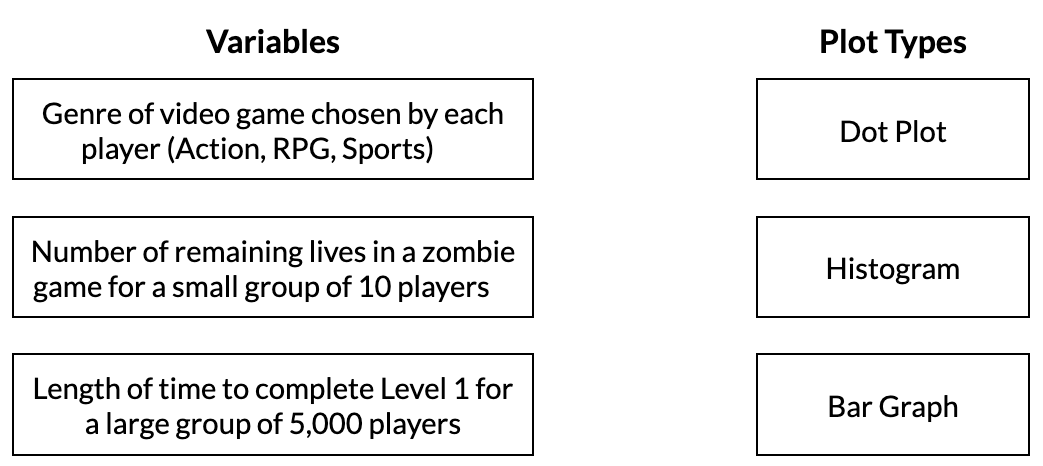
A data scientist needs to choose the correct type of plot for their data. Match the variable to the most appropriate plot type by drawing a line to connect them.
Investigative Task 4: Zooming In and Out
The tournament hosted 1,000 players and the organizers wanted to analyze their ages, as well as how many hours they spent playing video games each week.
-
Should the organizers use a dot plot or histogram for the variable Age? Explain your reasoning.
-
Bin Width Challenge: Suppose the minimum number of hours spent playing video games was 0 and the maximum was 40 hours. The organizers proposed two bin width options for the histogram and have asked you to select which scenario will provide a more detailed view about the players’ habits.
Scenario A: Use a bin width of 5 (0-4, 5-9, 10-14, 15-19, 20-24, etc.)
Scenario B: Use a bin width of 20 (0-19, 20-39, 40-59)
-
Which scenario should you choose? [Circle one.] Scenario A Scenario B
-
Explain your reasoning.
-
Investigative Task 5: Shape Sketching
One of the events at the tournament was extremely popular among players because the video game was set to “Easy Mode” for all participants. Most players got a perfect score of 100 points, and very few players scored below 40 points.
-
Create a sketch of what this distribution might look like.
[Hint: Think about where most of the data would be and if the distribution would have a tail or not.]-
Sketch:
-
Describe the shape of the distribution.
-